


Financial information
Long-term consolidated financial data
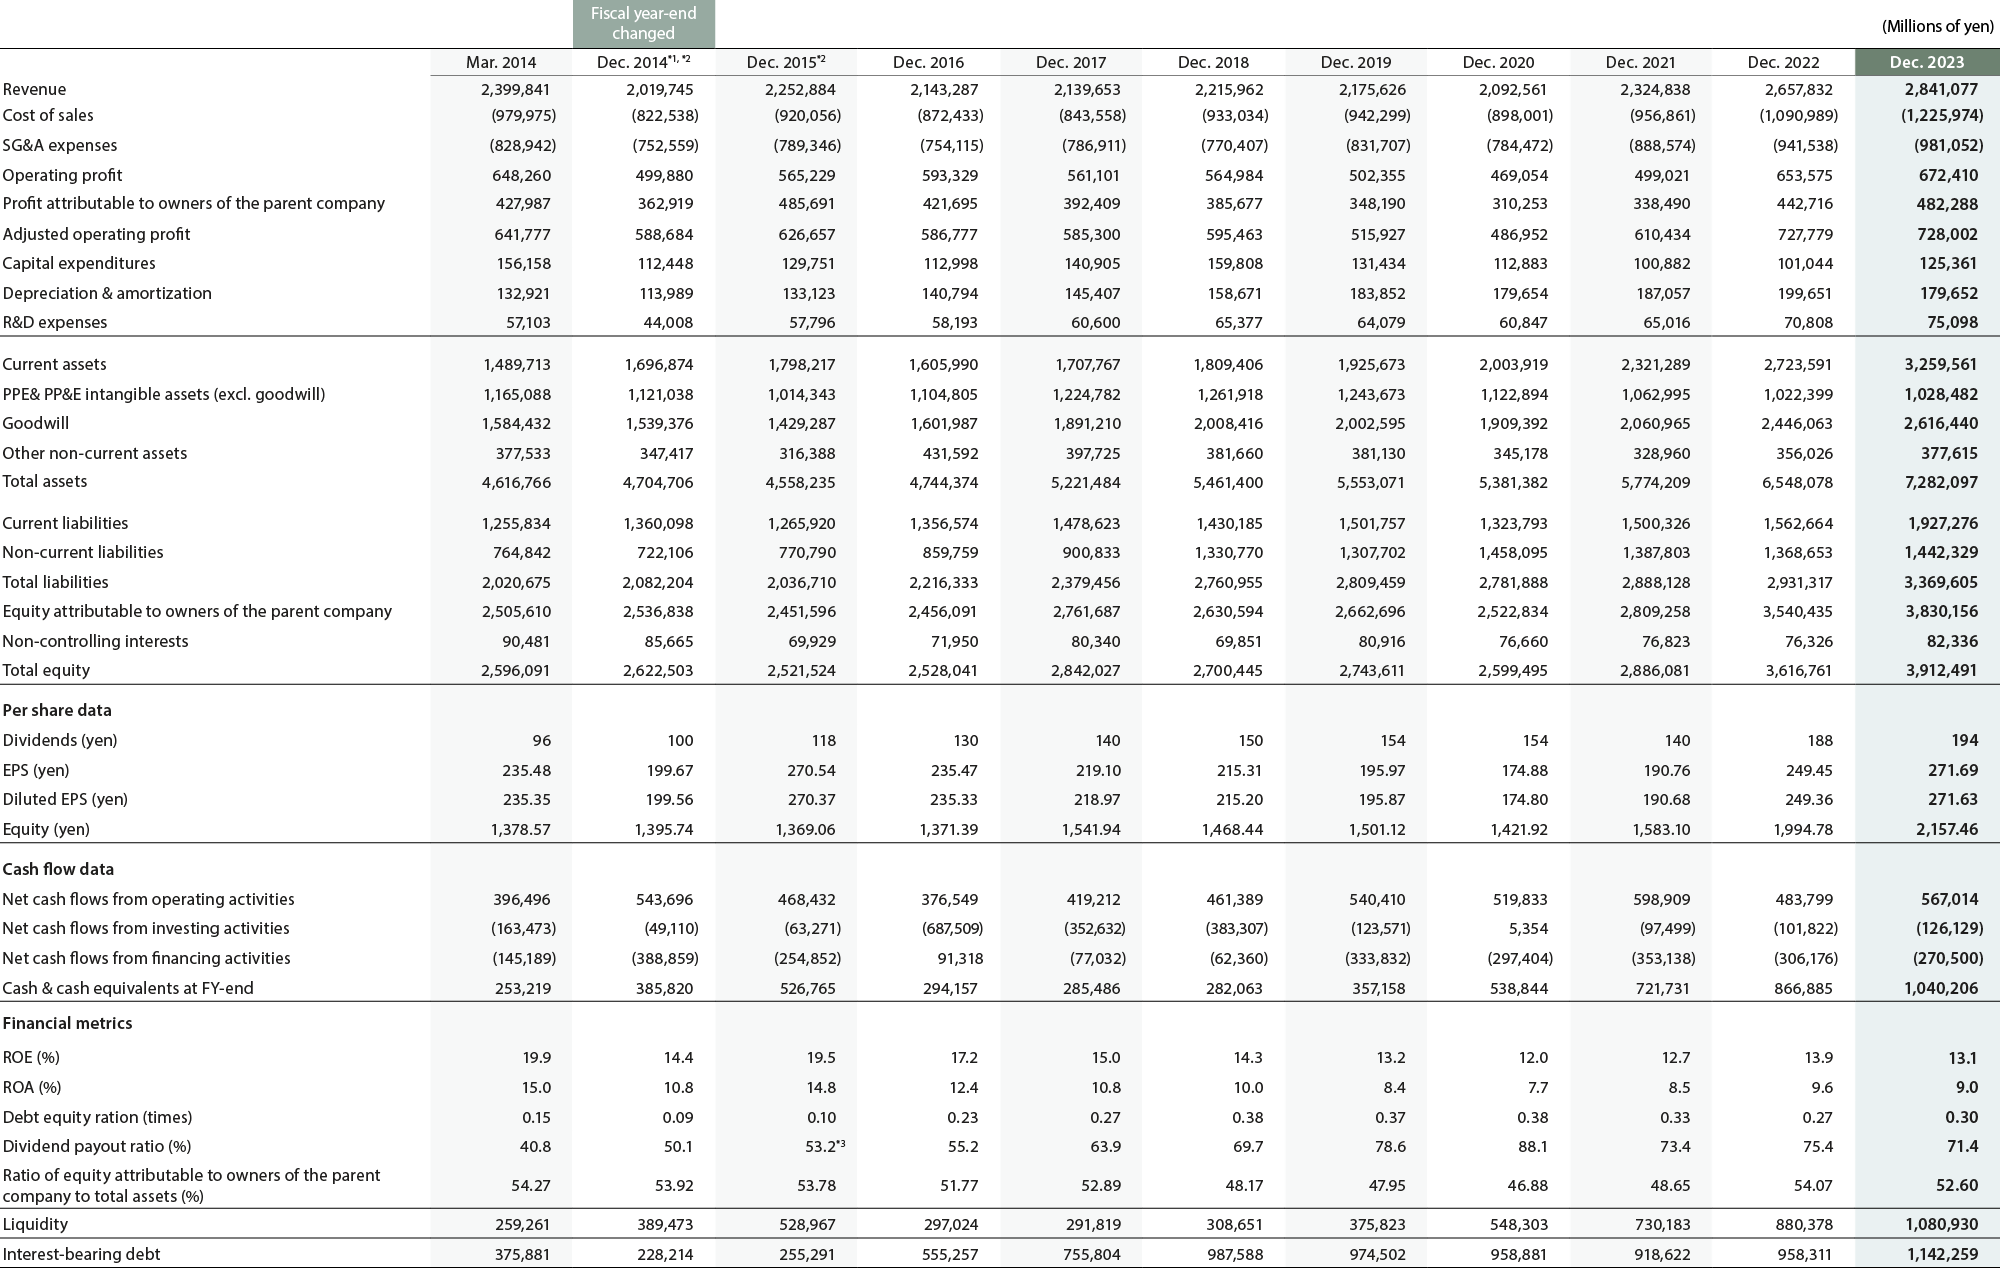
*1
FY2014 was nine months long (Jan.-Sep. 2014) because of a change in fiscal year-end from March to December
*2
In 2015, the beverage business was classed as a discontinued operation, due to the Company transferring its shares and other securities in its beverage vending machine operator subsidiary, as well as terminating the manufacturing and sale of beverages. Revenue, Cost of sales, SG&A expenses, Operating profit, Adjusted operating profit, Capital expenditures, Depreciation & amortization and R&D expenses for 2014 and 2015 shown on this page are based on values for continuing operations
*3
In 2015, the beverage business was classed as a discontinued operation, due to the Company transferring its shares and other securities in its beverage vending machine operator subsidiary, as well as terminating the manufacturing and sale of beverages. The consolidated dividend payout ratio, including the discontinued operation, was 43.6%


Financial data for each business
-
Revenue by business segment

-
Consolidated adjusted operating profit by business segment

Tobacco business FY2023 financial data overview
-
Total volume

-
Core revenue

-
Adjusted operating profit

-
Revenue by business segment(JPY BN)

Note:
The results for fiscal year 2022 and fiscal year 2023 on a reported basis have been adjusted to include the impact of hyperinflationary accounting in accordance with the requirements stipulated in IAS 29. The results for fiscal year 2022 and fiscal year 2023 on a constant FX basis have been calculated to exclude amounts of revenue and profit that have increased due to hyperinflation in certain markets
-
Volume (–)
-
- Total volume growth was more than offset by an unfavorable market mix
Price/Mix (+)
-
- Pricing contribution in multiple markets, including the Philippines, Russia and the UK, partially offset by lower product mix due to downtrading in key markets
Others (–)
-
- Higher input costs within the supply chain
- Investments towards both combustibles and HTS (heated tobacco sticks)
FX (–)
-
- Unfavorable foreign exchange impact on AOP, mainly due to the depreciation of several local currencies from emerging markets
Tobacco business: Breakdown of core revenue by cluster
(JPN BN)
|
Asia |
Western Europe |
EMA |
Total |
|---|---|---|---|---|
2022 |
804.9 |
538.8 |
971.5 |
2,315.2 |
Volume |
+2.4 |
–40.9 |
+41.3 |
+2.8 |
Price/Mix |
–18.9 |
+54.6 |
+108.6 |
+144.3 |
2023@PY |
788.3 |
552.5 |
1,121.5 |
2,462.4 |
FX |
+8.6 |
+50.7 |
–43.1 |
+16.3 |
2023 |
796.9 |
603.3 |
1,078.5 |
2,478.6 |
Tobacco business: Breakdown of adjusted operating profit by cluster
(JPN BN)
|
Asia |
Western Europe |
EMA |
Total |
|---|---|---|---|---|
2022 |
267.5 |
219.3 |
267.1 |
754.0 |
Volume |
–12.0 |
–37.6 |
+19.0 |
–30.6 |
Price |
–16.9 |
+51.0 |
+101.6 |
+135.7 |
Others |
+10.9 |
–14.2 |
–68.3 |
–71.6 |
2023@PY |
249.5 |
218.5 |
319.4 |
787.5 |
FX |
–3.7 |
+12.9 |
–47.0 |
–37.7 |
2023 |
245.8 |
231.4 |
272.5 |
749.8 |
Tobacco business: Key Market and Volume & Share evolution*
|
Total volume (BNU) |
YoY |
Total SoM |
YoY |
|---|---|---|---|---|
Japan |
63.7 |
+1.3% |
42.8% |
+0.3ppt |
The Philippines |
24.1 |
–4.7% |
42.4% |
+3.9ppt |
Taiwan |
14.0 |
–3.4% |
50.3% |
+1.4ppt |
Italy |
18.7 |
+1.6% |
23.2% |
+0.2ppt |
Spain |
14.4 |
–5.0% |
27.9% |
–0.1ppt |
The U.K. |
15.2 |
–18.7% |
43.7% |
–0.9ppt |
Romania |
7.6 |
+4.6% |
27.4% |
–0.1ppt |
Russia |
77.3 |
+0.7% |
37.4% |
+0.8ppt |
Turkey |
36.4 |
+12.8% |
26.9% |
–0.9ppt |
*
Total SoM is computed based on combustibles and heated tobacco products industry size for Japan, Italy, Spain, the U.K., Romania, and Russia
Rest of the key markets are computed based on combustibles


